
Welcome to our Virtual Showroom
Introduction movie
How did WIND Hellas win market share quickly based on our hybrid Android TV (DVB-OTT) deployment.
SHOW MEMulti-tenant – Android TV
Reference case: how benefit in terms of time to market and cost efficiencies. Learn from this Android TV and multi-tenant deployment for TSTT-Amplia.
SHOW MEZappware backoffice
How to guarantee a great UX based on Zappware's backoffice, powered by our Analytics and OSS monitoring tools.
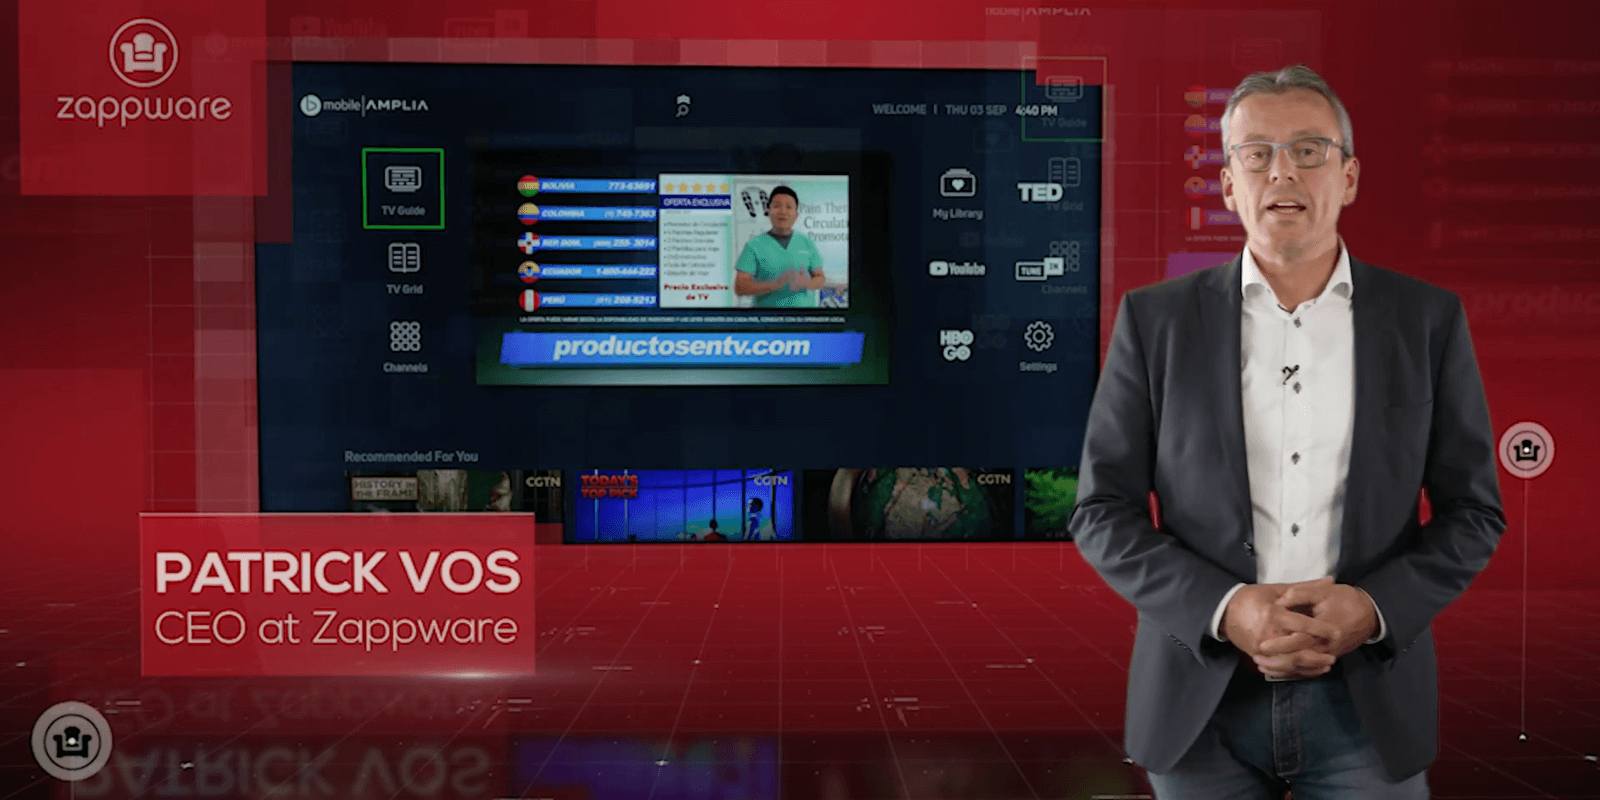
SHOW MEHow did WIND Hellas win market share quickly based on our hybrid Android TV (DVB-OTT) deployment
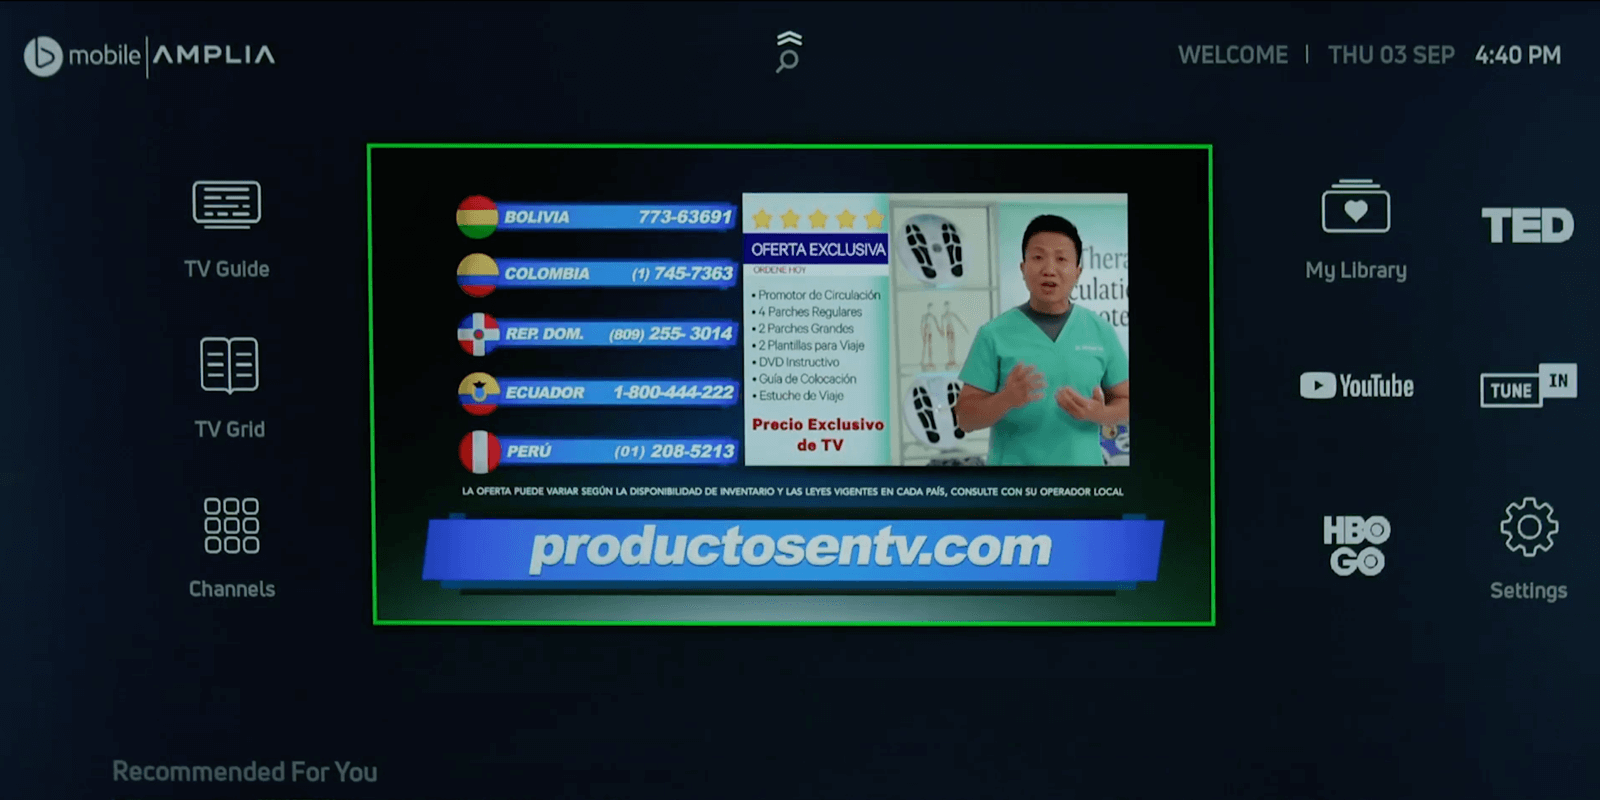
Reference case on Android TV and multi-tenant deployment for TSTT-Amplia
Reference case: how benefit in terms of time to market and cost efficiencies. Learn from this Android TV and multi-tenant deployment for TSTT-Amplia.

Download this case study
Zappware backoffice
How to guarantee a great UX based on Zappware's backoffice, powered by our Analytics and OSS monitoring tools.
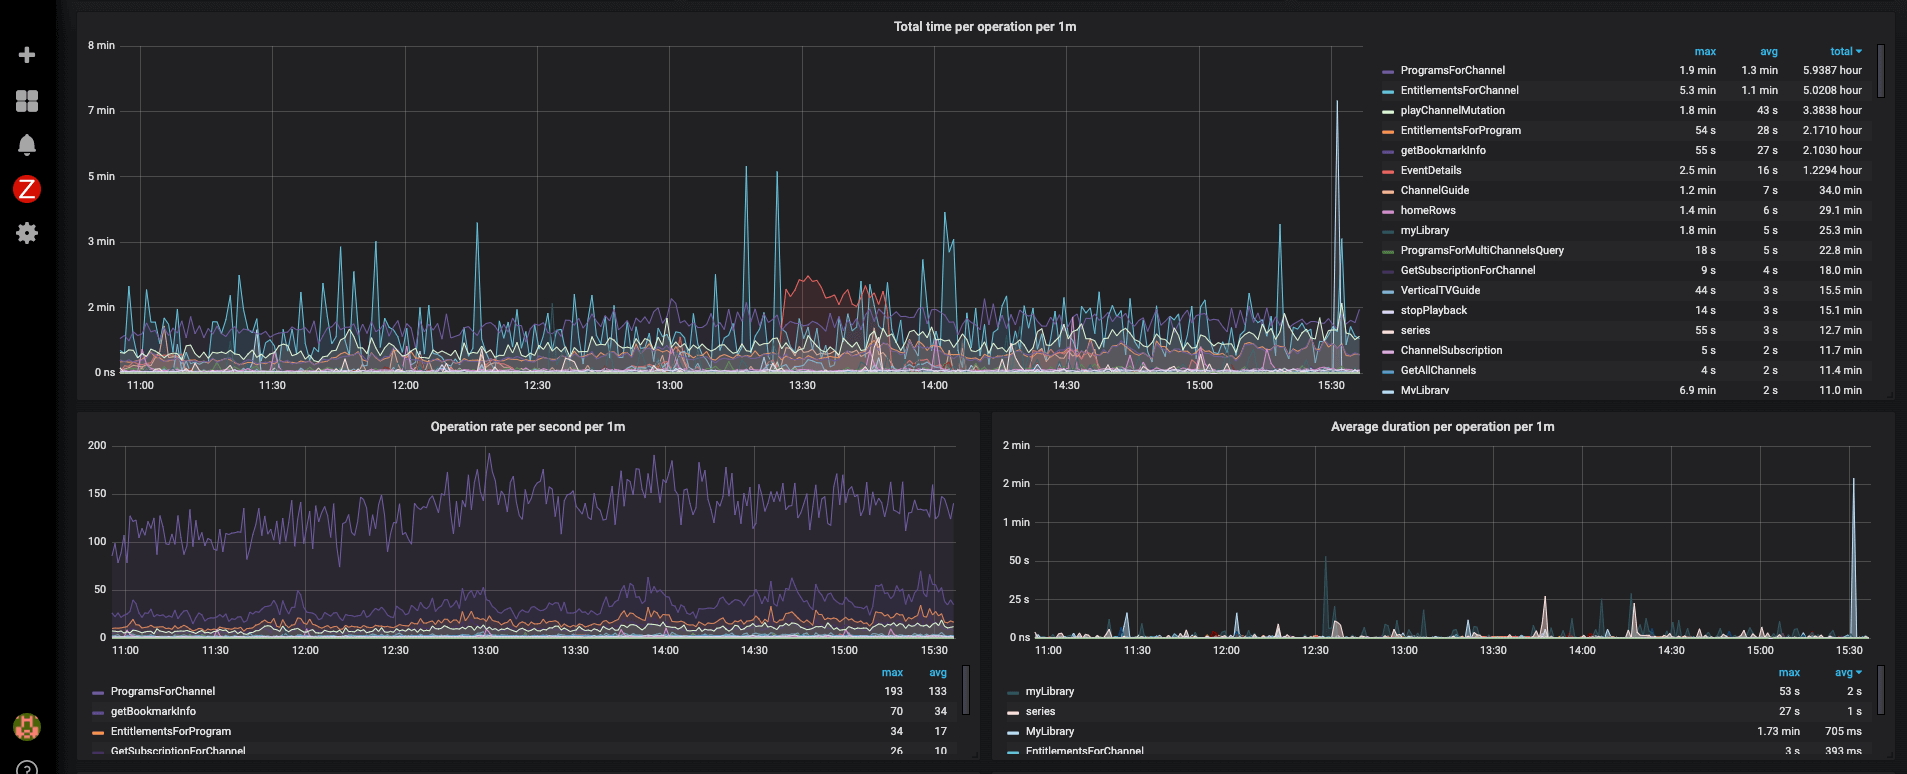
Monitoring
Operational metrics and data exposed by our backoffice. This allows an operations team to analyze real-time metrics about the operational status of the Zappware backoffice. Alerting can be configured for critical parameters.
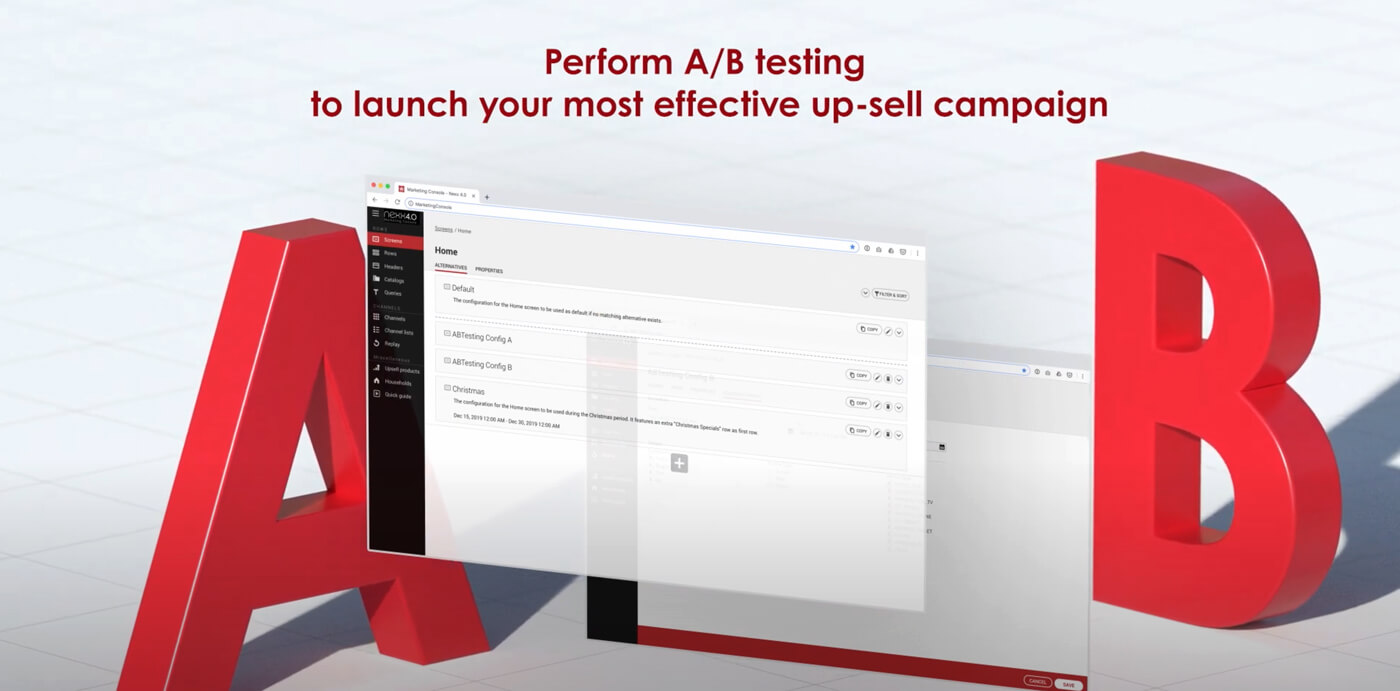
Marketing Console
A non-technical web interface for content and marketing teams to configure personalized campaigns and upsell banners.
Diagnostics and troubleshooting
These tools are used to troubleshoot the system and individual devices. Customer Service teams can now effectively find root causes and detect patterns. Diagnostics can be performed reactively during troubleshooting or automated to detect patterns from a relevant sample of devices. Diagnostics can be performed on e.g. WiFi signal, DVB channels, Bitrates, EPG errors, etc...
Reporting
Reports are typically used by the Operations Teams to regularly check performance statistics on the video ecosystem. The Zappware OSS tool contains the following modules: CRM report, Health report, NPVR report and QoS report with graphs to indicate the behavior during each hour of the day, averaged over all devices.
Analytics platform
The Zappware Analytics platform combines business analytics with operational analytics. Real-time Insights are provided based on data produced by Zappware's front-end clients and backoffice. Marketing people and Operations teams can draw actionable conclusions to improve the UX.
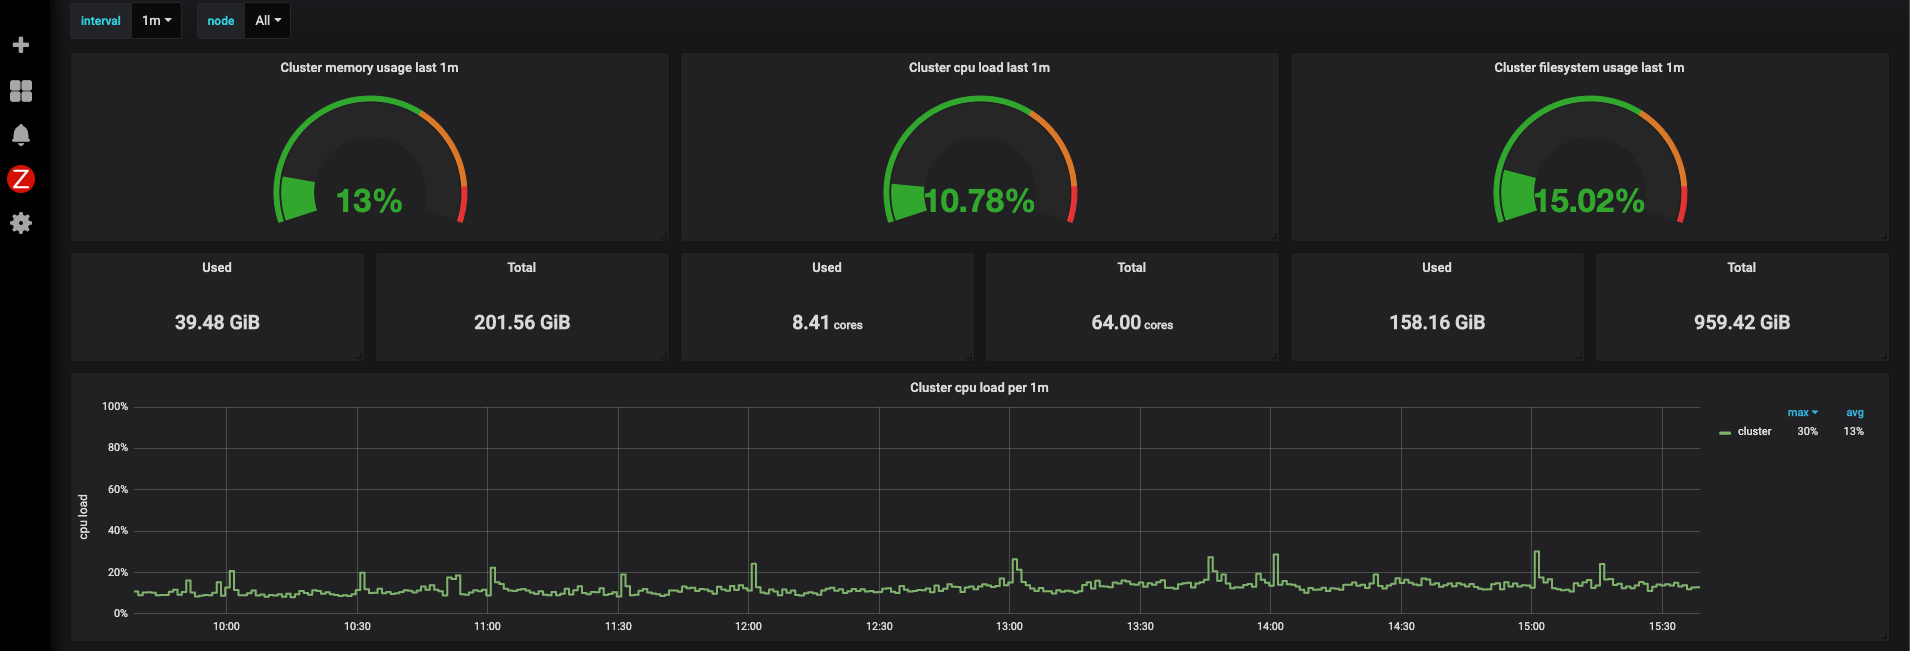
End-to-end monitoring
The dashboards provide operational metrics and data exposed by all the components in the video ecosystem. Real-time statistics and alerts are provided to operations staff to monitor components which might be overloaded or out-of-service. Data is pulled from video reception, encoding, Video CDN, network switches in headend, NAS storage for NPVR and relevant API endpoints. As a result, pro-active monitoring helps guaranteeing a great UX as well as avoiding outages.